![]()
![]()
![]()
![]()
![]()
![]() 斯坦福ML(Matlab
斯坦福ML(Matlab )公开课最后一次编程练习,实现了异常检测算法并应用于服务器异常检测,然后利用协同过滤实现一个电影推荐系统。至此又填完一个坑,matlab感觉也入门了
 。
。![]()
![]()
异常检测
你收集了一些服务器的流量与延迟数据,假设大部分服务器都是正常的,请找出不正常的那些。
这是个简单的二维数据,加载与可视化:
%% ================== Part 1: Load Example Dataset  ===================
%  We start this exercise by using a small dataset that is easy to
%  visualize.
%
%  Our example case consists of 2 network server statistics across
%  several machines: the latency and throughput of each machine.
%  This exercise will help us find possibly faulty (or very fast) machines.
%

fprintf('Visualizing example dataset for outlier detection.\n\n');

%  The following command loads the dataset. You should now have the
%  variables X, Xval, yval in your environment
load('ex8data1.mat');

%  Visualize the example dataset
plot(X(:, 1), X(:, 2), 'bx');
axis([0 30 0 30]);
xlabel('Latency (ms)');
ylabel('Throughput (mb/s)');

fprintf('Program paused. Press enter to continue.\n');
pause
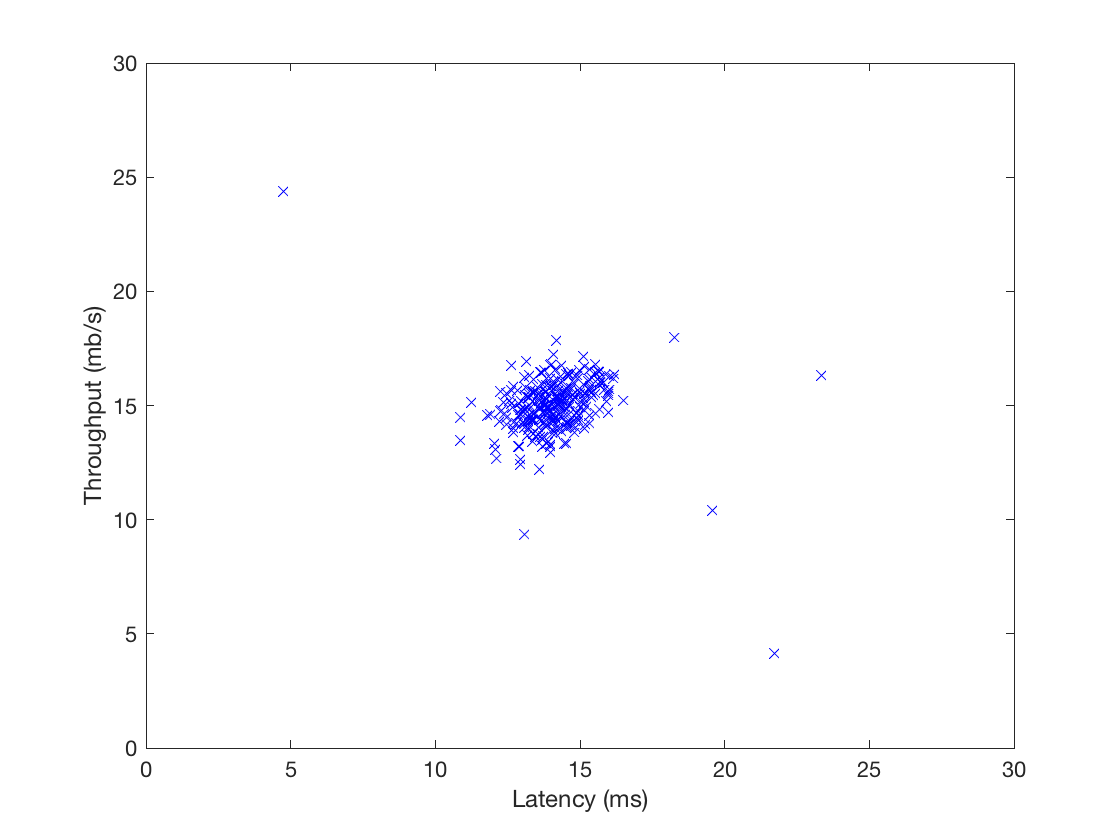
高斯分布
吴恩达教授说,生活中大部分数据都符合高斯分布。这里也假设数据服从高斯分布,定义数据集![]() ,其中
,其中![]() 。对每个特征x_i,都需要估计一个高斯分布。也就是说,i=1…n,对第i维
。对每个特征x_i,都需要估计一个高斯分布。也就是说,i=1…n,对第i维![]() ,找到均值
,找到均值![]() 和方差
和方差![]() ,使其满足高斯分布:
,使其满足高斯分布:

上式是高斯分布的密度函数,对于多变量高斯分布,其实现如下:
function p = multivariateGaussian(X, mu, Sigma2)
%MULTIVARIATEGAUSSIAN Computes the probability density function of the
%multivariate gaussian distribution.
%    p = MULTIVARIATEGAUSSIAN(X, mu, Sigma2) Computes the probability
%    density function of the examples X under the multivariate gaussian
%    distribution with parameters mu and Sigma2. If Sigma2 is a matrix, it is
%    treated as the covariance matrix. If Sigma2 is a vector, it is treated
%    as the \sigma^2 values of the variances in each dimension (a diagonal
%    covariance matrix)
%

k = length(mu);

if (size(Sigma2, 2) == 1) || (size(Sigma2, 1) == 1)
    Sigma2 = diag(Sigma2);
end

X = bsxfun(@minus, X, mu(:)');
p = (2 * pi) ^ (- k / 2) * det(Sigma2) ^ (-0.5) * ...
    exp(-0.5 * sum(bsxfun(@times, X * pinv(Sigma2), X), 2));

end
该函数适用于矩阵,可一次性返回X中每个数据点的概率密度。传入参数Sigma2如果是向量,则以该向量为对角线创建协方差矩阵。
估计高斯分布的参数
其实就是计算均值和方差啦:
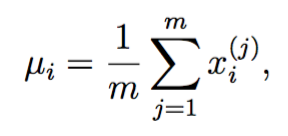
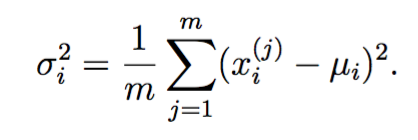
注意matlab的var方差默认除以(m-1),和上面的定义不一样。
实现如下:
function [mu sigma2] = estimateGaussian(X)
%ESTIMATEGAUSSIAN This function estimates the parameters of a
%Gaussian distribution using the data in X
%   [mu sigma2] = estimateGaussian(X),
%   The input X is the dataset with each n-dimensional data point in one row
%   The output is an n-dimensional vector mu, the mean of the data set
%   and the variances sigma^2, an n x 1 vector
%

% Useful variables
[m, n] = size(X);

% You should return these values correctly
mu = zeros(n, 1);
sigma2 = zeros(n, 1);

% ====================== YOUR CODE HERE ======================
% Instructions: Compute the mean of the data and the variances
%               In particular, mu(i) should contain the mean of
%               the data for the i-th feature and sigma2(i)
%               should contain variance of the i-th feature.
%
mu = mean(X)';
%var normalizes V by N-1 if N>1,where N is the sample size.
sigma2 = var(X) * (n -1) / n;

for i = 1:n
    X(:,i) = X(:,i) - mu(i);
end
sigma2 = 1 / m * sum(X .^2)';


% =============================================================


end
怪简单的,调用方法如下:
%% ================== Part 2: Estimate the dataset statistics ===================
%  For this exercise, we assume a Gaussian distribution for the dataset.
%
%  We first estimate the parameters of our assumed Gaussian distribution,
%  then compute the probabilities for each of the points and then visualize
%  both the overall distribution and where each of the points falls in
%  terms of that distribution.
%
fprintf('Visualizing Gaussian fit.\n\n');

%  Estimate my and sigma2
[mu sigma2] = estimateGaussian(X);

%  Returns the density of the multivariate normal at each data point (row)
%  of X
p = multivariateGaussian(X, mu, sigma2);
可视化高斯分布
既然每个数据点都有一个概率密度,不如将该密度可视化出来:
function visualizeFit(X, mu, sigma2)
%VISUALIZEFIT Visualize the dataset and its estimated distribution.
%   VISUALIZEFIT(X, p, mu, sigma2) This visualization shows you the
%   probability density function of the Gaussian distribution. Each example
%   has a location (x1, x2) that depends on its feature values.
%

[X1,X2] = meshgrid(0:.5:35);
Z = multivariateGaussian([X1(:) X2(:)],mu,sigma2);
Z = reshape(Z,size(X1));

plot(X(:, 1), X(:, 2),'bx');
hold on;
% Do not plot if there are infinities
if (sum(isinf(Z)) == 0)
    contour(X1, X2, Z, 10.^(-20:3:0)');
end
hold off;

end
meshgrid接受一个向量,创建两个大小相等的方阵,一个矩阵的每行都是向量的拷贝,另一个每列都是向量的拷贝。这样在一个矩阵中任取一个元素作为x,在另一个矩阵的对应位置取到y,就能得到指定区间的格子坐标。
然后contour用向量10.^(-20:3:0)'限制只要概率密度等于这七个数的七条等高线,于是得到:
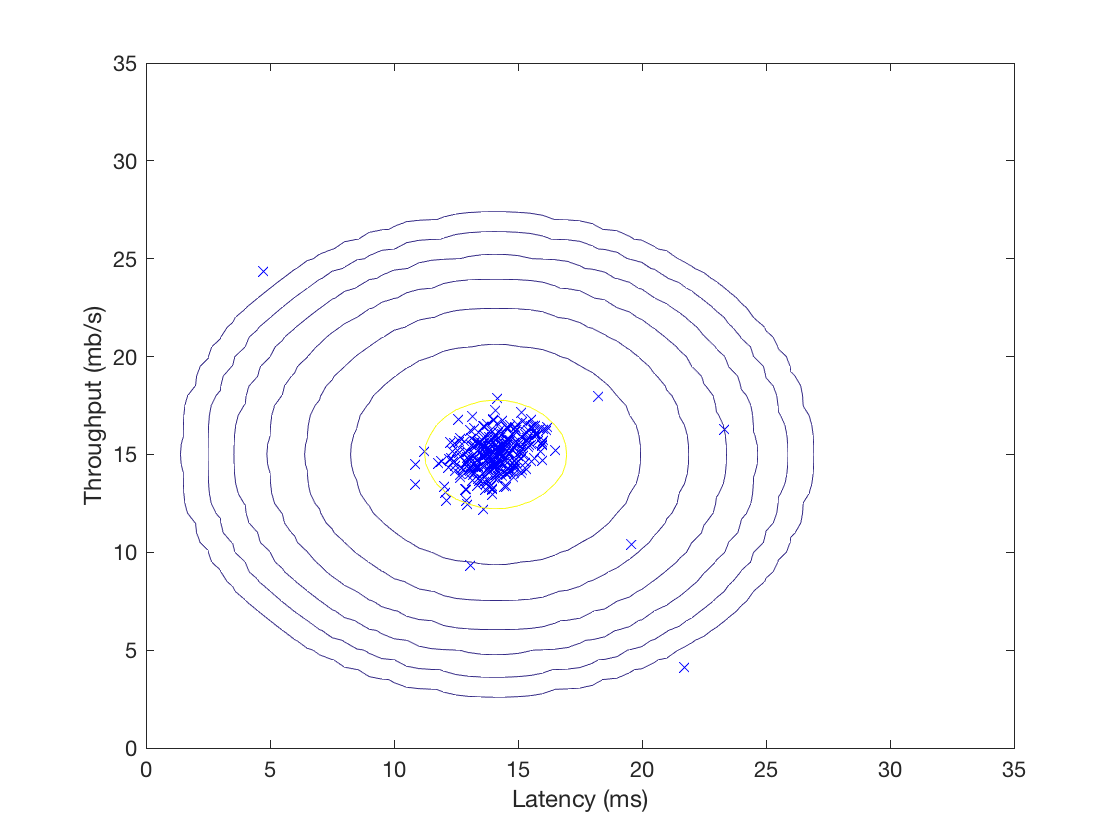
选择阈值
概率密度有了,怎么选取一个阈值![]() ,来决定概率小于该阈值的点为离群点呢?
,来决定概率小于该阈值的点为离群点呢?
一种方法是利用交叉验证集(有label表示该点是否是离群点)的F1值来决定,我们尝试多个![]() ,并基于该
,并基于该![]() 计算交叉验证集上的F1值,取最高者返回。F1定义如下:
计算交叉验证集上的F1值,取最高者返回。F1定义如下:

其中
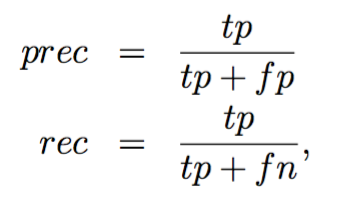
tp代表真阳,fp代表假阳,fn表示假阴。
实现如下:
function [bestEpsilon bestF1] = selectThreshold(yval, pval)
%SELECTTHRESHOLD Find the best threshold (epsilon) to use for selecting
%outliers
%   [bestEpsilon bestF1] = SELECTTHRESHOLD(yval, pval) finds the best
%   threshold to use for selecting outliers based on the results from a
%   validation set (pval) and the ground truth (yval).
%

bestEpsilon = 0;
bestF1 = 0;
F1 = 0;

stepsize = (max(pval) - min(pval)) / 1000;
for epsilon = min(pval):stepsize:max(pval)

    % ====================== YOUR CODE HERE ======================
    % Instructions: Compute the F1 score of choosing epsilon as the
    %               threshold and place the value in F1. The code at the
    %               end of the loop will compare the F1 score for this
    %               choice of epsilon and set it to be the best epsilon if
    %               it is better than the current choice of epsilon.
    %
    % Note: You can use predictions = (pval < epsilon) to get a binary vector
    %       of 0's and 1's of the outlier predictions
    predictions = (pval < epsilon);
    tp = sum((predictions == 1) & (yval == 1));
    fp = sum((predictions == 1) & (yval == 0));
    fn = sum((predictions == 0) & (yval == 1));
    if tp + fp ~= 0
        prec = tp / (tp + fp);
    else
        prec = 0;
    end
    if tp + fn ~= 0
        rec = tp / (tp + fn);
    else
        rec = 0;
    end
    if prec + rec ~= 0
        F1 = 2 * prec * rec / (prec + rec);
    else
        F1 = 0;
    end

    % =============================================================

    if F1 > bestF1
       bestF1 = F1;
       bestEpsilon = epsilon;
    end
end

end
调用方法如下:
%% ================== Part 4: Multidimensional Outliers ===================
%  We will now use the code from the previous part and apply it to a
%  harder problem in which more features describe each datapoint and only
%  some features indicate whether a point is an outlier.
%

%  Loads the second dataset. You should now have the
%  variables X, Xval, yval in your environment
load('ex8data2.mat');

%  Apply the same steps to the larger dataset
[mu sigma2] = estimateGaussian(X);

%  Training set
p = multivariateGaussian(X, mu, sigma2);

%  Cross-validation set
pval = multivariateGaussian(Xval, mu, sigma2);

%  Find the best threshold
[epsilon F1] = selectThreshold(yval, pval);

fprintf('Best epsilon found using cross-validation: %e\n', epsilon);
fprintf('Best F1 on Cross Validation Set:  %f\n', F1);
fprintf('# Outliers found: %d\n', sum(p < epsilon));
fprintf('   (you should see a value epsilon of about 1.38e-18)\n\n');
pause
输出:
Best epsilon found using cross-validation: 8.990853e-05
Best F1 on Cross Validation Set:  0.875000
   (you should see a value epsilon of about 8.99e-05)
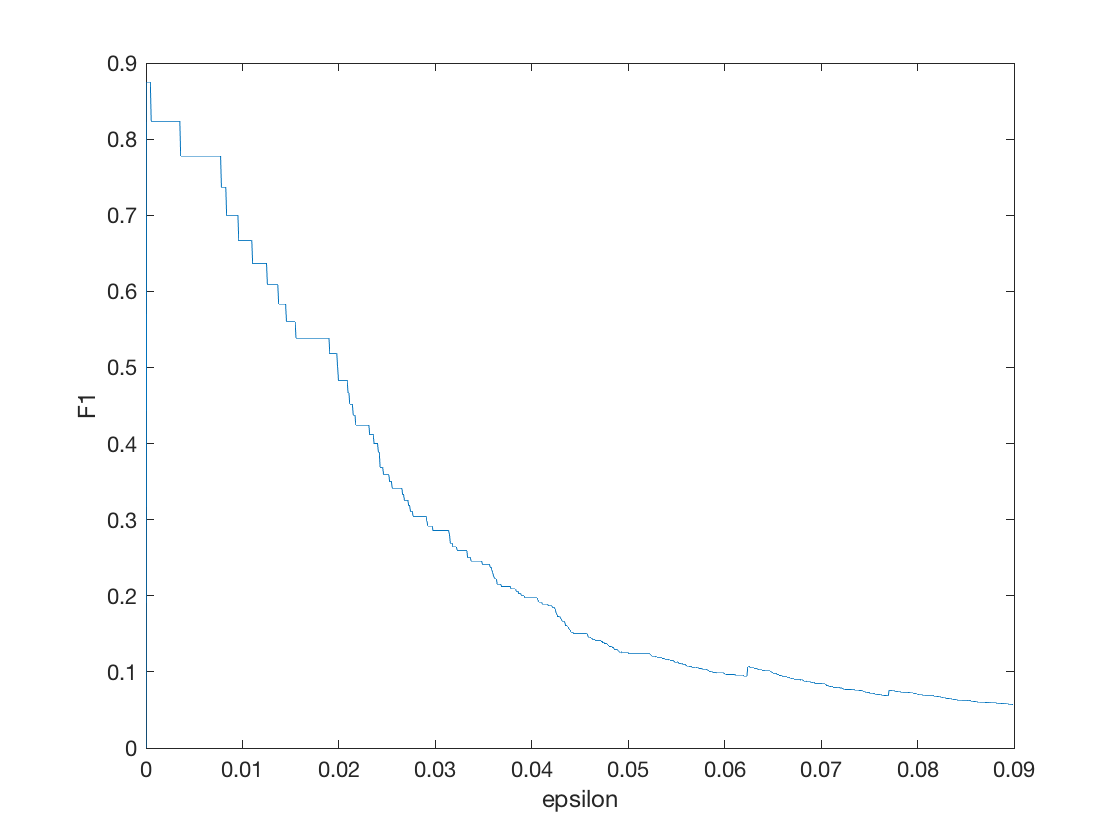
如果我们将epsilon与F1的关系可视化出来,得到
把epslion坐标缩放一下,集中注意力于0到0.001之间:
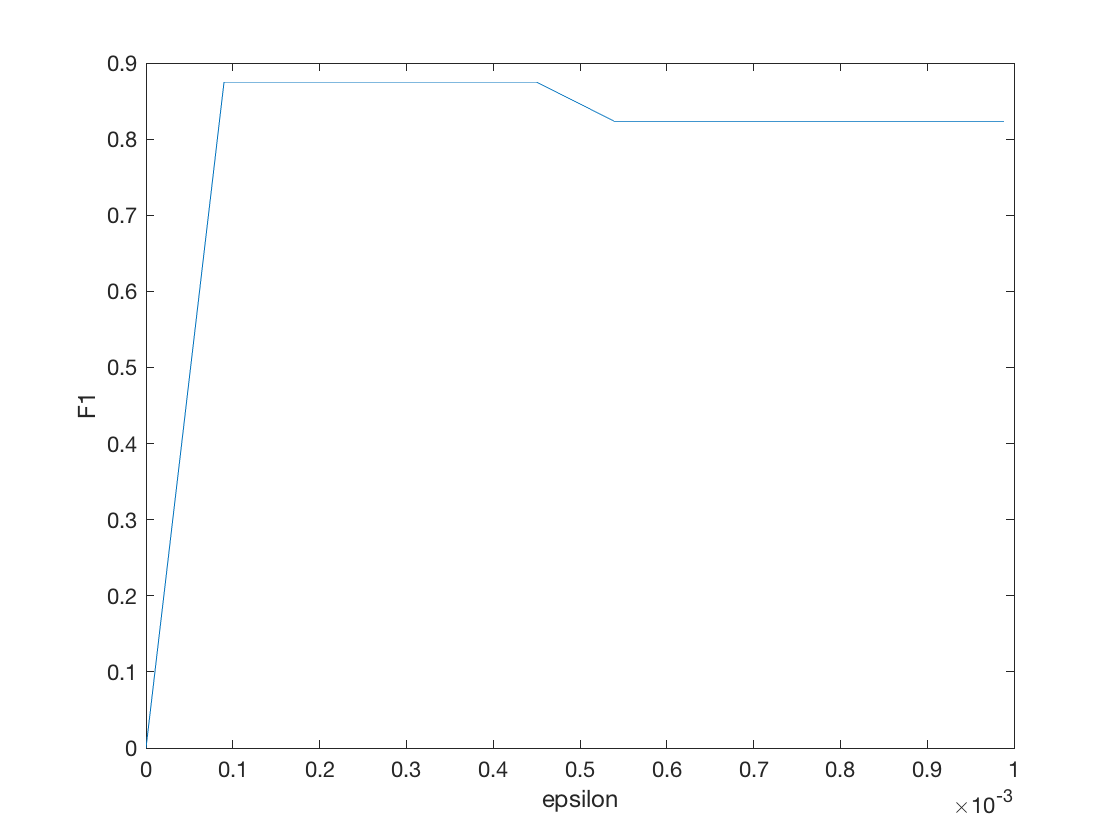
F1的确有一个先增后减的过程。
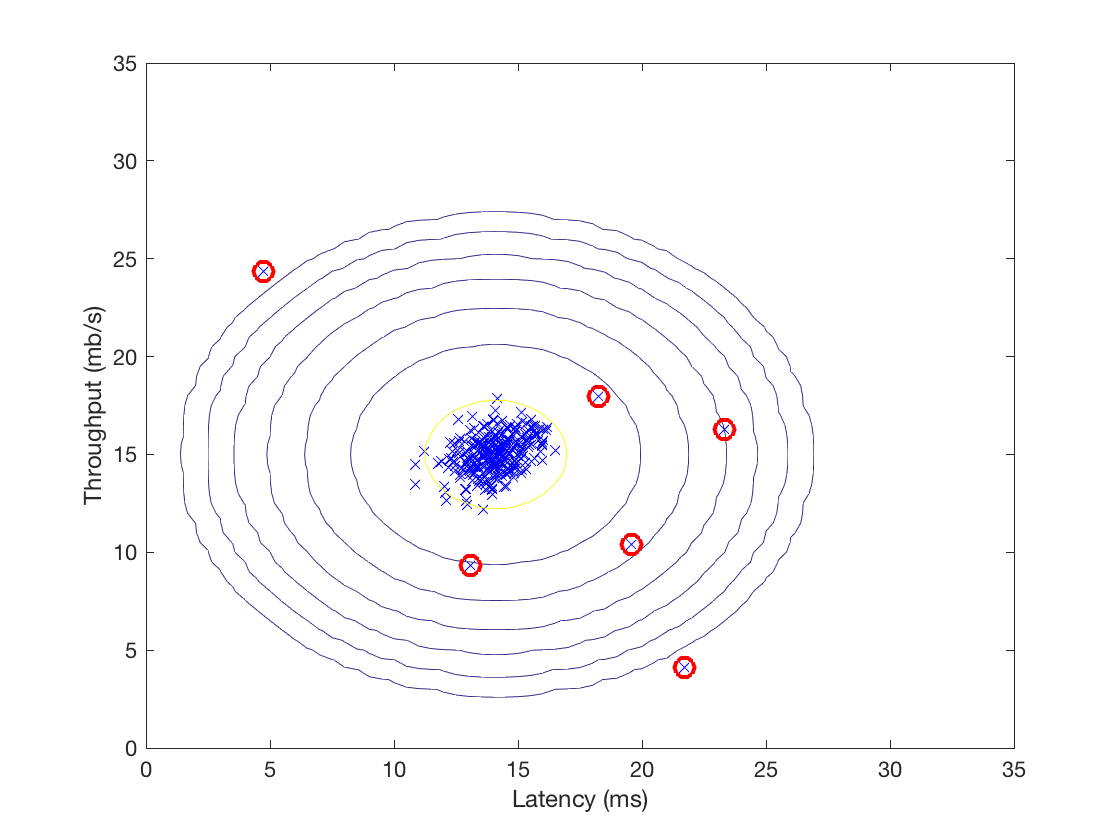
接着我们可以利用这个阈值找出离群点并高亮:
推荐系统
这部分练习实现一个简单的推荐系统,应用于电影数据集。
电影数据集
该数据集大约有1000个用户,2000部电影,一些用户给电影的打分(1到5星级)。数据包含两个大小相同的矩阵Y和R,两者大小都是电影数*用户数。当![]() =1时,
=1时,![]() 代表用户j对电影i的评分,否则代表用户j还未对电影i进行评分。
代表用户j对电影i的评分,否则代表用户j还未对电影i进行评分。
为了帮助大家熟悉数据集,首先完成一个简单任务:计算第一部电影的平均分:
%% =============== Part 1: Loading movie ratings dataset ================
%  You will start by loading the movie ratings dataset to understand the
%  structure of the data.
%
fprintf('Loading movie ratings dataset.\n\n');

%  Load data
load ('ex8_movies.mat');

%  Y is a 1682x943 matrix, containing ratings (1-5) of 1682 movies on
%  943 users
%
%  R is a 1682x943 matrix, where R(i,j) = 1 if and only if user j gave a
%  rating to movie i

%  From the matrix, we can compute statistics like average rating.
fprintf('Average rating for movie 1 (Toy Story): %f / 5\n\n', ...
        mean(Y(1, R(1, :))));
R矩阵是布尔矩阵,可直接作为索引用。
我们还可以将Y矩阵作为一张图片可视化出来,每个像素代表用户对电影的评分,越亮分数越高。
%  We can "visualize" the ratings matrix by plotting it with imagesc
imagesc(Y);
ylabel('Movies');
xlabel('Users');

fprintf('\nProgram paused. Press enter to continue.\n');
pause;
得到:
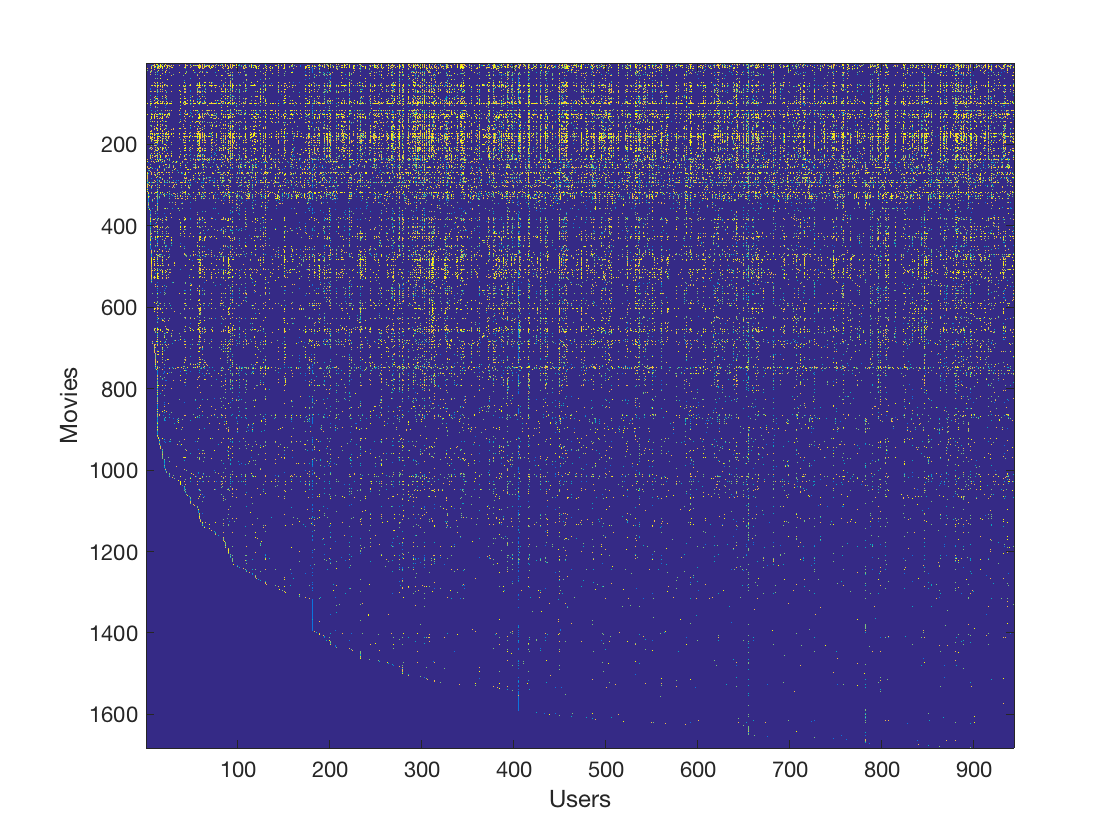
推荐系统使用协同过滤算法,预测用户未曾观看的电影的评分,并为其推荐评分最高的电影。
接下来的代码中会经常看到如下两个矩阵:

X大小为电影数*特征数,第i行代表第i部电影的特征,Theta大小为用户数*特征数,第j行代表第j个用户对应的参数。在本次试验中,特征数为100。
协同过滤学习算法
协同过滤学习算法其实是个线性回归,给定上述两个矩阵,用户j对电影i的评分的假设函数为:
![]()
而算法的目的就是通过对数据集的学习,最小化误差的平方和,得到上述两个矩阵(协同算法的参数)。同线性回归一样,可以使用开箱即用的优化函数fmincg。
损失函数
损失函数(无正则化项)定义为:

与线性回归唯一的不同点在于,只计算r(i,j)=1的那些误差。
协同过滤梯度
损失函数的梯度定义如下:
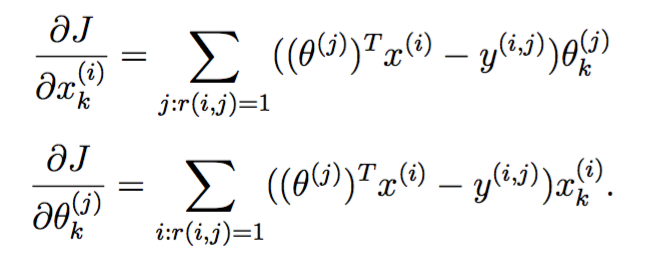
注意X的梯度矩阵与X大小相同,Theta也是如此。
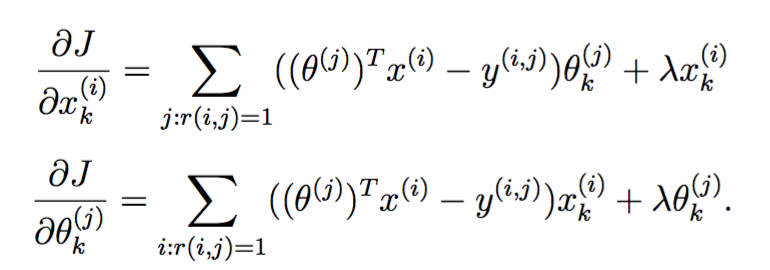
正则化的损失函数和梯度
分别定义如下:

实现如下
function [J, grad] = cofiCostFunc(params, Y, R, num_users, num_movies, ...
                                  num_features, lambda)
%COFICOSTFUNC Collaborative filtering cost function
%   [J, grad] = COFICOSTFUNC(params, Y, R, num_users, num_movies, ...
%   num_features, lambda) returns the cost and gradient for the
%   collaborative filtering problem.
%

% Unfold the U and W matrices from params
X = reshape(params(1:num_movies*num_features), num_movies, num_features);
Theta = reshape(params(num_movies*num_features+1:end), ...
                num_users, num_features);


% You need to return the following values correctly
J = 0;
X_grad = zeros(size(X));
Theta_grad = zeros(size(Theta));

% ====================== YOUR CODE HERE ======================
% Instructions: Compute the cost function and gradient for collaborative
%               filtering. Concretely, you should first implement the cost
%               function (without regularization) and make sure it is
%               matches our costs. After that, you should implement the
%               gradient and use the checkCostFunction routine to check
%               that the gradient is correct. Finally, you should implement
%               regularization.
%
% Notes: X - num_movies  x num_features matrix of movie features
%        Theta - num_users  x num_features matrix of user features
%        Y - num_movies x num_users matrix of user ratings of movies
%        R - num_movies x num_users matrix, where R(i, j) = 1 if the
%            i-th movie was rated by the j-th user
%
% You should set the following variables correctly:
%
%        X_grad - num_movies x num_features matrix, containing the
%                 partial derivatives w.r.t. to each element of X
%        Theta_grad - num_users x num_features matrix, containing the
%                     partial derivatives w.r.t. to each element of Theta
%
M = (X * Theta' - Y) .^ 2;
J = sum(sum(R .* M)) / 2;
J = J + lambda / 2 * (sum(sum(X .^ 2)) + sum(sum(Theta .^ 2)));

X_grad = (R .* (X * Theta' - Y)) * Theta;
X_grad = X_grad + lambda * X;
Theta_grad = (R .* (X * Theta' - Y))' * X;
Theta_grad = Theta_grad + lambda * Theta;


% =============================================================

grad = [X_grad(:); Theta_grad(:)];

end
斯坦福练习中还写了个数值上检查梯度函数的脚本,与训练神经网络时的梯度校验是一个原理,略过。
调用方法:
%% ========= Part 4: Collaborative Filtering Cost Regularization ========
%  Now, you should implement regularization for the cost function for
%  collaborative filtering. You can implement it by adding the cost of
%  regularization to the original cost computation.
%

%  Evaluate cost function
J = cofiCostFunc([X(:) ; Theta(:)], Y, R, num_users, num_movies, ...
               num_features, 1.5);

fprintf(['Cost at loaded parameters (lambda = 1.5): %f '...
         '\n(this value should be about 31.34)\n'], J);

fprintf('\nProgram paused. Press enter to continue.\n');
pause;
训练推荐系统
有了损失函数,如同线性回归一样,使用matlab的无约束最小化优化函数即可:
%% ================== Part 7: Learning Movie Ratings ====================
%  Now, you will train the collaborative filtering model on a movie rating
%  dataset of 1682 movies and 943 users
%

fprintf('\nTraining collaborative filtering...\n');

%  Load data
load('ex8_movies.mat');

%  Y is a 1682x943 matrix, containing ratings (1-5) of 1682 movies by
%  943 users
%
%  R is a 1682x943 matrix, where R(i,j) = 1 if and only if user j gave a
%  rating to movie i

%  Add our own ratings to the data matrix
Y = [my_ratings Y];
R = [(my_ratings ~= 0) R];

%  Normalize Ratings
[Ynorm, Ymean] = normalizeRatings(Y, R);

%  Useful Values
num_users = size(Y, 2);
num_movies = size(Y, 1);
num_features = 10;

% Set Initial Parameters (Theta, X)
X = randn(num_movies, num_features);
Theta = randn(num_users, num_features);

initial_parameters = [X(:); Theta(:)];

% Set options for fmincg
options = optimset('GradObj', 'on', 'MaxIter', 100);

% Set Regularization
lambda = 10;
theta = fmincg (@(t)(cofiCostFunc(t, Y, R, num_users, num_movies, ...
                                num_features, lambda)), ...
                initial_parameters, options);

% Unfold the returned theta back into U and W
X = reshape(theta(1:num_movies*num_features), num_movies, num_features);
Theta = reshape(theta(num_movies*num_features+1:end), ...
                num_users, num_features);

fprintf('Recommender system learning completed.\n');

fprintf('\nProgram paused. Press enter to continue.\n');
pause;
执行推荐
假设新来了一个用户,他观看并给一些电影打了分:
%% ============== Part 6: Entering ratings for a new user ===============
%  Before we will train the collaborative filtering model, we will first
%  add ratings that correspond to a new user that we just observed. This
%  part of the code will also allow you to put in your own ratings for the
%  movies in our dataset!
%
movieList = loadMovieList();

%  Initialize my ratings
my_ratings = zeros(1682, 1);

% Check the file movie_idx.txt for id of each movie in our dataset
% For example, Toy Story (1995) has ID 1, so to rate it "4", you can set
my_ratings(1) = 4;

% Or suppose did not enjoy Silence of the Lambs (1991), you can set
my_ratings(98) = 2;

% We have selected a few movies we liked / did not like and the ratings we
% gave are as follows:
my_ratings(7) = 3;
my_ratings(12)= 5;
my_ratings(54) = 4;
my_ratings(64)= 5;
my_ratings(66)= 3;
my_ratings(69) = 5;
my_ratings(183) = 4;
my_ratings(226) = 5;
my_ratings(355)= 5;

fprintf('\n\nNew user ratings:\n');
for i = 1:length(my_ratings)
    if my_ratings(i) > 0
        fprintf('Rated %d for %s\n', my_ratings(i), ...
                 movieList{i});
    end
end

fprintf('\nProgram paused. Press enter to continue.\n');
pause;
其中loadMovieList加载了电影标题与id的映射表,没什么好看的。该用户观看了下列电影:
New user ratings:
Rated 4 for Toy Story (1995)
Rated 3 for Twelve Monkeys (1995)
Rated 5 for Usual Suspects, The (1995)
Rated 4 for Outbreak (1995)
Rated 5 for Shawshank Redemption, The (1994)
Rated 3 for While You Were Sleeping (1995)
Rated 5 for Forrest Gump (1994)
Rated 2 for Silence of the Lambs, The (1991)
Rated 4 for Alien (1979)
Rated 5 for Die Hard 2 (1990)
Rated 5 for Sphere (1998)
这家伙似乎喜欢看动作片啊:

为其推荐电影:
%% ================== Part 8: Recommendation for you ====================
%  After training the model, you can now make recommendations by computing
%  the predictions matrix.
%

p = X * Theta';
my_predictions = p(:,1) + Ymean;

movieList = loadMovieList();

[r, ix] = sort(my_predictions, 'descend');
fprintf('\nTop recommendations for you:\n');
for i=1:10
    j = ix(i);
    fprintf('Predicting rating %.1f for movie %s\n', my_predictions(j), ...
            movieList{j});
end

fprintf('\n\nOriginal ratings provided:\n');
for i = 1:length(my_ratings)
    if my_ratings(i) > 0
        fprintf('Rated %d for %s\n', my_ratings(i), ...
                 movieList{i});
    end
end
这里推荐了预测评分top10 。
得到:
Top recommendations for you:
Predicting rating 8.6 for movie Star Wars (1977)
Predicting rating 8.5 for movie Titanic (1997)
Predicting rating 8.3 for movie Shawshank Redemption, The (1994)
Predicting rating 8.3 for movie Raiders of the Lost Ark (1981)
Predicting rating 8.2 for movie Schindler's List (1993)
Predicting rating 8.2 for movie Good Will Hunting (1997)
Predicting rating 8.1 for movie Empire Strikes Back, The (1980)
Predicting rating 8.0 for movie Usual Suspects, The (1995)
Predicting rating 8.0 for movie As Good As It Gets (1997)
Predicting rating 8.0 for movie Braveheart (1995)
似乎还行。
 码农场
码农场