ML可视化学习
最近在学习一些基础的ML算法,比起枯燥的公式,我更喜欢写Python实现,再通过Matplotlib这个强大的作图库可视化出来。比如最简单的感知机梯度下降算法,给定数据集,用不同的颜色和形状,可以很方便地画出来:
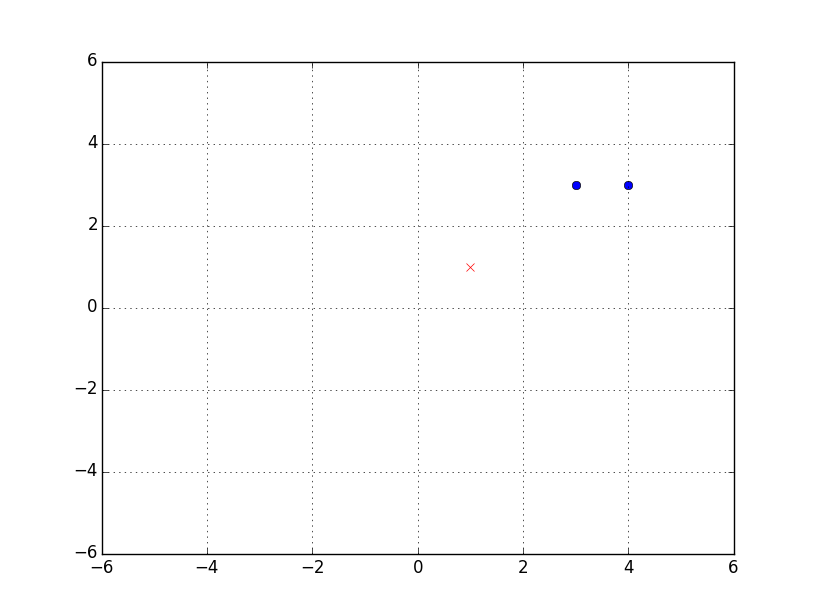
上图描述了数据集[[(3, 3), 1], [(4, 3), 1], [(1, 1), -1]]。
同样,对于每次更新的分离超平面,也可以画出来:
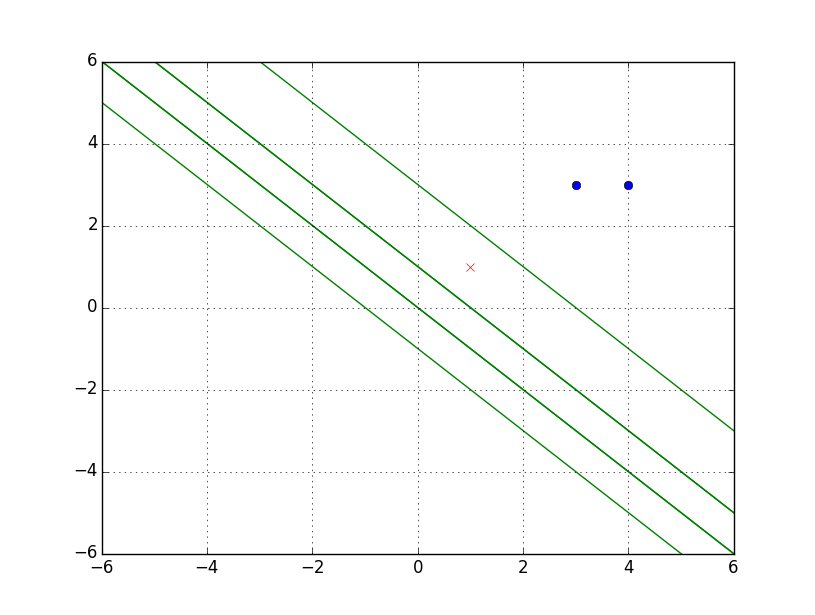
上图描述了以下分离超平面:
   w     b
[3, 3] 1
[2, 2] 0
[1, 1] -1
[0, 0] -2
[3, 3] -1
[2, 2] -2
[1, 1] -3
那么问题来了,感知机学习算法是一个错误驱动的算法,分离超平面是一个不断更新的过程,上图虽然将中间过程画了出来,但是有些超平面重叠在了一起,怎么办呢?我一开始觉得好办,给每条线加个标记不就行了。借助上面的输出就能判断哪个平面在先哪个平面在后,于是就有了下图:
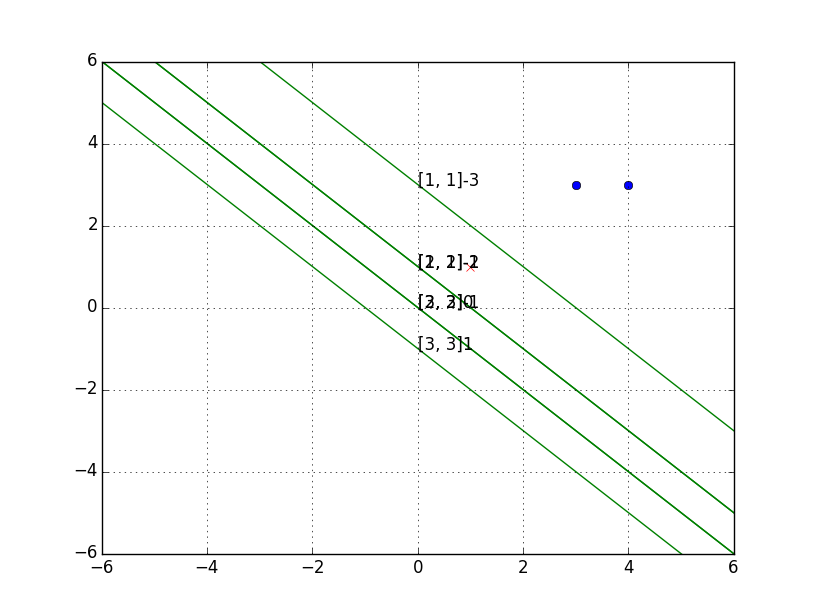
如你所见,标记也重叠在一起了。
这时,我发现matplotlib还支持动画,于是现学现卖,有了下面的故事。
matplotlib动画入门
# -*- coding:utf-8 -*-
# Filename: sin.py
# Author:hankcs
# Date: 2015/1/30 22:41
import numpy as np
from matplotlib import pyplot as plt
from matplotlib import animation

# first set up the figure, the axis, and the plot element we want to animate
fig = plt.figure()
ax = plt.axes(xlim=(0, 2), ylim=(-2, 2))
line, = ax.plot([], [], lw=2)

# initialization function: plot the background of each frame
def init():
    line.set_data([], [])
    return line,

# animation function.  this is called sequentially
def animate(i):
    x = np.linspace(0, 2, 1000)
    y = np.sin(2 * np.pi * (x - 0.01 * i))
    line.set_data(x, y)
    return line,

# call the animator.  blit=true means only re-draw the parts that have changed.
anim = animation.FuncAnimation(fig, animate, init_func=init,
                               frames=200, interval=20, blit=True)
plt.show()
首先新建了图片、坐标和一条空白的线作为全局变量。然后init方法是一个初始化的方法,什么都不干。animate方法中的参数i表示当前帧数,通过正弦函数接受i生成了坐标集合,并且更新到线条中去。接下来新建了anim对象,几个参数的名称都很好懂,最后一个blit方法是告诉matplotlib记得在每帧之前擦除init方法返回的那些图元。
运行效果如图:
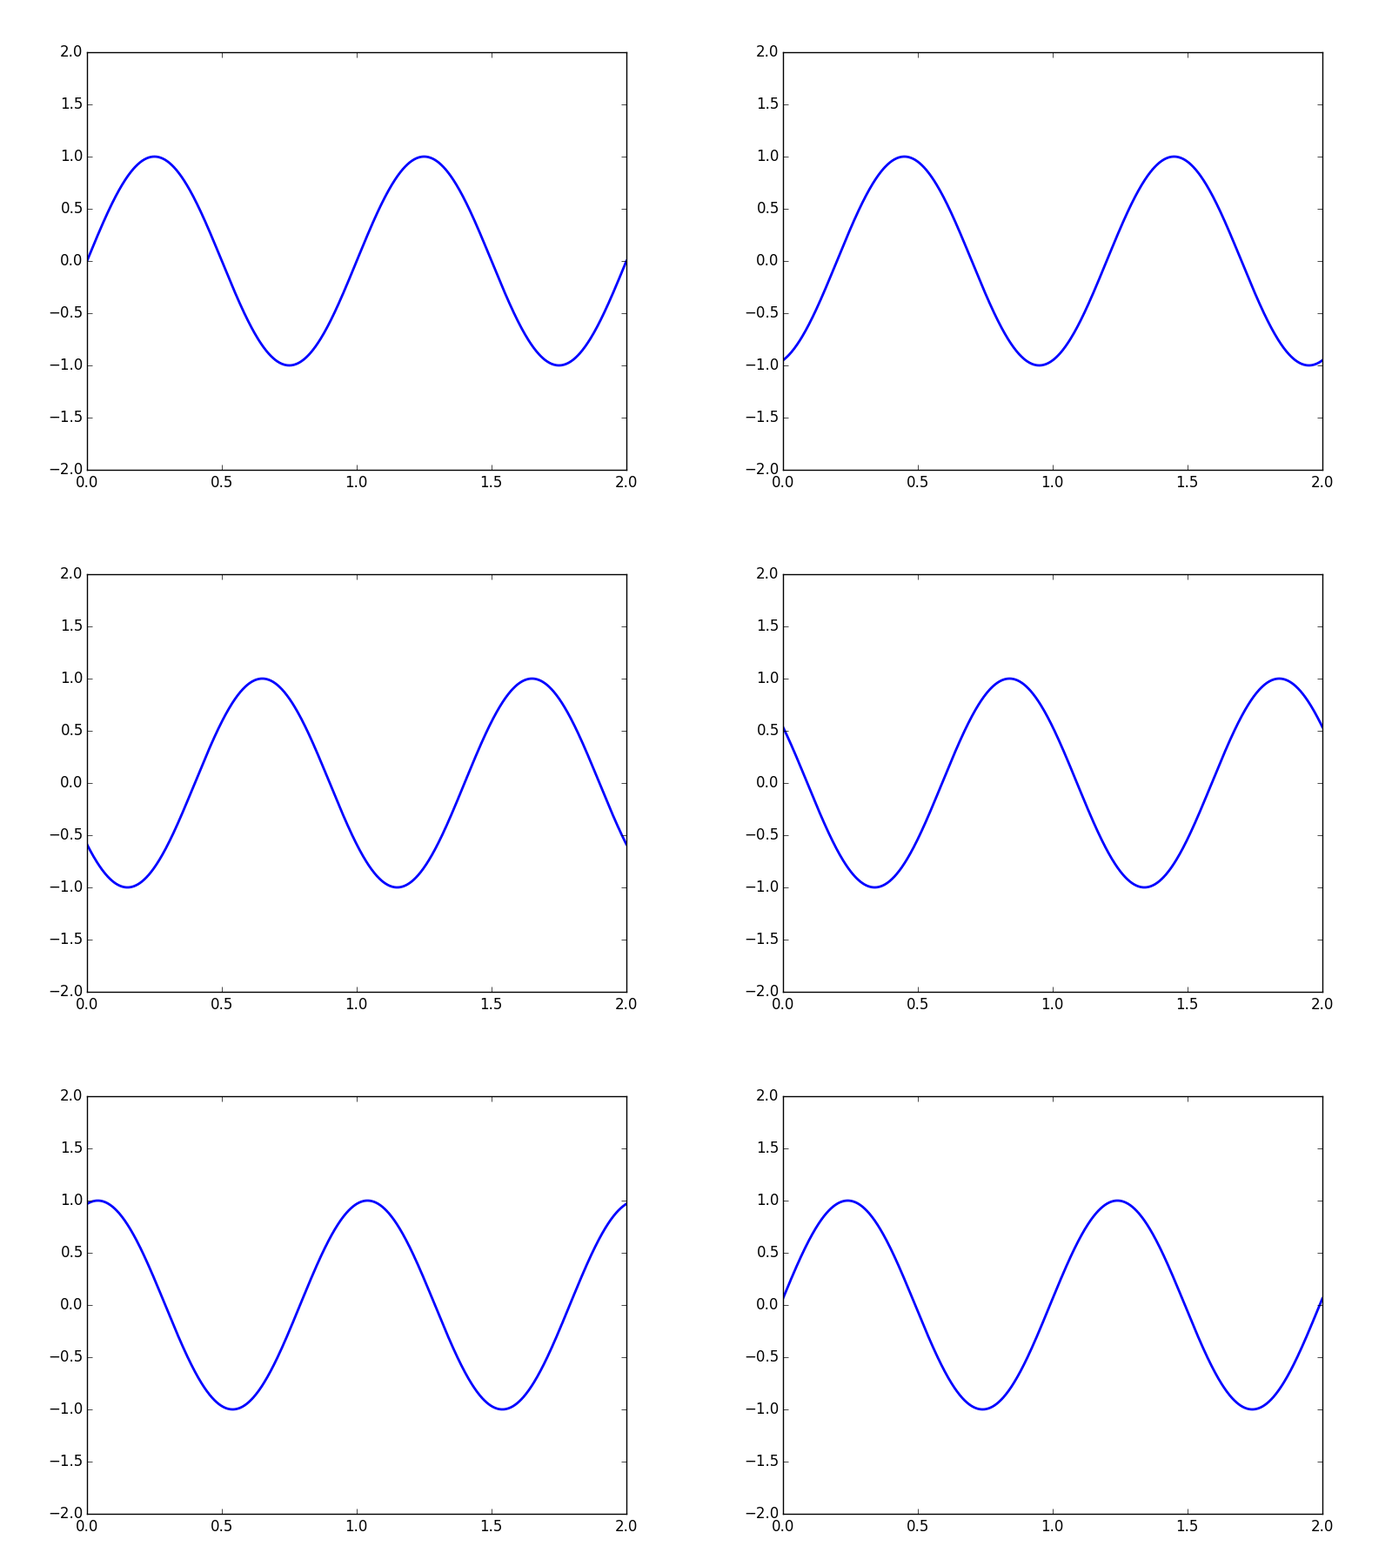
也许你会好奇上图是怎么来的,用其他工具截图吗?不,在万能的Python面前,导出gif是小菜一碟。
导出GIF
安装ImageMagick
ImageMagick是一个类似于编码器的工具,下载地址:http://www.imagemagick.org/script/binary-releases.php
配置matplotlib
先看看自己的配置文件放在了哪里:
import matplotlib
matplotlib.matplotlib_fname()
会输出类似一个路径,用文本文件打开这个文件,编辑末尾的:
animation.convert_path: '"C:\Program Files\ImageMagick-6.9.0-Q16\convert.exe"'
记得取消“animation.convert_path”前面的注释。这样应该就配置好了,接下来用一句话就可以导出gif:
anim.save('perceptron.gif', fps=2, writer='imagemagick')
在我的机器上,意外地发生了错误:
UserWarning: imagemagick MovieWriter unavailable
warnings.warn ("% s MovieWriter unavailable" writer%)
后来单步了一下,发现是matplotlib解析配置文件的逻辑有bug:

如图,正确的位置是C:\Program Files\ImageMagick-6.9.0-Q16\convert.exe,可是上图解析后前后都多了一个\号。我的解决方法是编辑C:\Program Files\Python27\Lib\site-packages\matplotlib\__init__.py,在1101行加一句:
rcParams['animation.convert_path'] = 'C:\Program Files\ImageMagick-6.9.0-Q16\convert.exe'
强行覆盖错误的配置。

接下来就能正常工作了。
感知机梯度下降算法可视化
感知机算法代码
终于到了最激动人心的时刻了,有了上述知识,就可以完美地可视化这个简单的算法:
# -*- coding:utf-8 -*-
# Filename: train2.1.py
# Author:hankcs
# Date: 2015/1/30 16:29
import copy
from matplotlib import pyplot as plt
from matplotlib import animation

training_set = [[(3, 3), 1], [(4, 3), 1], [(1, 1), -1]]
w = [0, 0]
b = 0
history = []


def update(item):
    """
    update parameters using stochastic gradient descent
    :param item: an item which is classified into wrong class
    :return: nothing
    """
    global w, b, history
    w[0] += 1 * item[1] * item[0][0]
    w[1] += 1 * item[1] * item[0][1]
    b += 1 * item[1]
    print w, b
    history.append([copy.copy(w), b])
    # you can uncomment this line to check the process of stochastic gradient descent


def cal(item):
    """
    calculate the functional distance between 'item' an the dicision surface. output yi(w*xi+b).
    :param item:
    :return:
    """
    res = 0
    for i in range(len(item[0])):
        res += item[0][i] * w[i]
    res += b
    res *= item[1]
    return res


def check():
    """
    check if the hyperplane can classify the examples correctly
    :return: true if it can
    """
    flag = False
    for item in training_set:
        if cal(item) <= 0:
            flag = True
            update(item)
    # draw a graph to show the process
    if not flag:
        print "RESULT: w: " + str(w) + " b: " + str(b)
    return flag


if __name__ == "__main__":
    for i in range(1000):
        if not check(): break

    # first set up the figure, the axis, and the plot element we want to animate
    fig = plt.figure()
    ax = plt.axes(xlim=(0, 2), ylim=(-2, 2))
    line, = ax.plot([], [], 'g', lw=2)
    label = ax.text([], [], '')

    # initialization function: plot the background of each frame
    def init():
        line.set_data([], [])
        x, y, x_, y_ = [], [], [], []
        for p in training_set:
            if p[1] > 0:
                x.append(p[0][0])
                y.append(p[0][1])
            else:
                x_.append(p[0][0])
                y_.append(p[0][1])

        plt.plot(x, y, 'bo', x_, y_, 'rx')
        plt.axis([-6, 6, -6, 6])
        plt.grid(True)
        plt.xlabel('x')
        plt.ylabel('y')
        plt.title('Perceptron Algorithm (www.hankcs.com)')
        return line, label


    # animation function.  this is called sequentially
    def animate(i):
        global history, ax, line, label

        w = history[i][0]
        b = history[i][1]
        if w[1] == 0: return line, label
        x1 = -7
        y1 = -(b + w[0] * x1) / w[1]
        x2 = 7
        y2 = -(b + w[0] * x2) / w[1]
        line.set_data([x1, x2], [y1, y2])
        x1 = 0
        y1 = -(b + w[0] * x1) / w[1]
        label.set_text(history[i])
        label.set_position([x1, y1])
        return line, label

    # call the animator.  blit=true means only re-draw the parts that have changed.
    print history
    anim = animation.FuncAnimation(fig, animate, init_func=init, frames=len(history), interval=1000, repeat=True,
                                   blit=True)
    plt.show()
    anim.save('perceptron.gif', fps=2, writer='imagemagick')
可视化
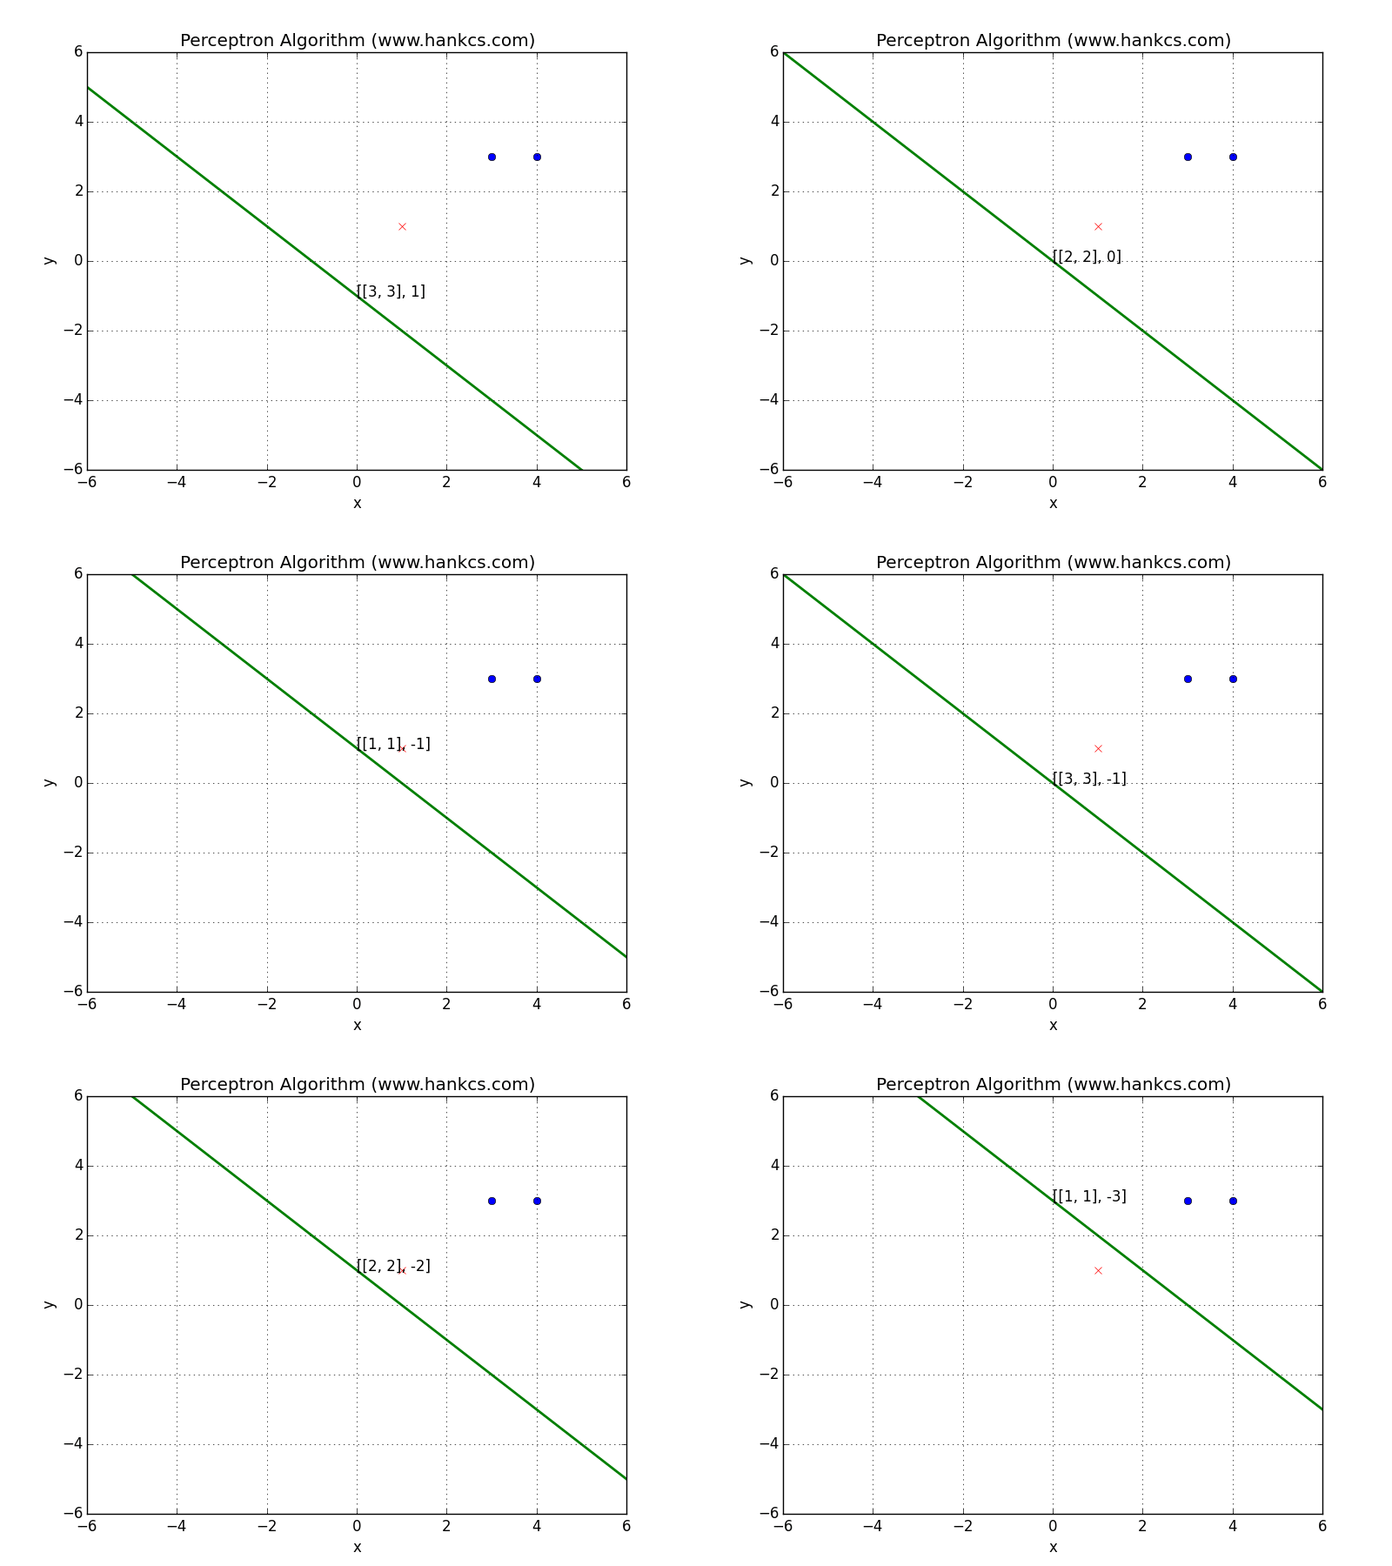
可见超平面被误分类点所吸引,朝着它移动,使得两者距离逐步减小,直到正确分类为止。通过这个动画,是不是对感知机的梯度下降算法有了更直观的感悟呢?
Reference
http://ipythonnb4jpnexp.blogspot.jp/2013/09/gif-matplotlib1.html
http://mytrix.me/2013/08/matplotlib-animation-tutorial/
![]() 知识共享署名-非商业性使用-相同方式共享:码农场 » 使用Matplotlib和Imagemagick实现算法可视化与GIF导出
知识共享署名-非商业性使用-相同方式共享:码农场 » 使用Matplotlib和Imagemagick实现算法可视化与GIF导出
 码农场
码农场
安装imagemagick后在目录C:\Program Files\ImageMagick-7.0.7-Q16\下没有convert.exe文件啊
这个最后怎么保存gif文件?不知道这个文件保存到哪里了?哥哥
我找到了,我在anim.save(‘c://perceptron.gif,fps=2,writer=’imagemagick”);就这样在C盘下面找到了。东西还是非常好的,感觉非常不错。
我怎找不到,请告知怎么找
animation.convert_path: ‘”C:Program FilesImageMagick-6.9.0-Q16convert.exe”‘
改为
animation.convert_path: C:Program FilesImageMagick-6.9.0-Q16convert.exe
就可以了。
按照导出 GIF 的步骤把东西都配置了可还是报错..
Traceback (most recent call last):
File “animation.py”, line 67, in
animation.save(‘../figures/rain.gif’, writer=’imagemagick’, fps=40, dpi=72)
File “/Applications/anaconda/lib/python2.7/site-packages/matplotlib/animation.py”, line 810, in save
writer.grab_frame(**savefig_kwargs)
File “/Applications/anaconda/lib/python2.7/site-packages/matplotlib/animation.py”, line 230, in grab_frame
dpi=self.dpi, **savefig_kwargs)
File “/Applications/anaconda/lib/python2.7/site-packages/matplotlib/figure.py”, line 1565, in savefig
self.canvas.print_figure(*args, **kwargs)
File “/Applications/anaconda/lib/python2.7/site-packages/matplotlib/backend_bases.py”, line 2232, in print_figure
**kwargs)
File “/Applications/anaconda/lib/python2.7/site-packages/matplotlib/backends/backend_agg.py”, line 519, in print_raw
fileobj.write(renderer._renderer.buffer_rgba())
IOError: [Errno 32] Broken pipe
不知道出了什么问题
我解决啦谢谢,原来是安装的时候没用 ports(我是 mac) 许多 dependence 没装,ImageMagic 没装好