![]() 这门课的编程练习很简单,大部分代码都给出了,只需要修改或添加一小部分。官方语言为matlab,但我更喜欢Python(讨厌jupyter)。但matlab保存动画更方便,所以决定双语字幕,左右开弓。
这门课的编程练习很简单,大部分代码都给出了,只需要修改或添加一小部分。官方语言为matlab,但我更喜欢Python(讨厌jupyter)。但matlab保存动画更方便,所以决定双语字幕,左右开弓。
算法主框架
这次的主题是感知机算法及可视化,算法主框架已经提供了:
def learn_perceptron(neg_examples_nobias, pos_examples_nobias, w_init, w_gen_feas,
                     pause=False):
    """Learns the weights of a perceptron for a 2-dimensional dataset and plots
    the perceptron at each iteration where an iteration is defined as one
    full pass through the data. If a generously feasible weight vector
    is provided then the visualization will also show the distance
    of the learned weight vectors to the generously feasible weight vector.

    Args:
        neg_examples_nobias (numpy.array) : The num_neg_examples x 2 matrix for the examples with target 0.
            num_neg_examples is the number of examples for the negative class.
        pos_examples_nobias (numpy.array) : The num_pos_examples x 2 matrix for the examples with target 1.
            num_pos_examples is the number of examples for the positive class.
        w_init (numpy.array)              : A 3-dimensional initial weight vector. The last element is the bias.
        w_gen_feas (numpy.array)          : A generously feasible weight vector.
        pause (bool)                      : Pause between iterations.
    Returns:
        numpy.array : The learned weight vector.
    """
    num_err_history = []
    w_dist_history = []

    # add column vector of ones for bias term
    neg_examples = np.hstack((neg_examples_nobias, np.ones((len(neg_examples_nobias), 1))))
    pos_examples = np.hstack((pos_examples_nobias, np.ones((len(pos_examples_nobias), 1))))

    if np.size(w_init):
        w = np.random.rand(3, 1)
    else:
        w = w_init

    if not np.size(w_gen_feas):
        w_gen_feas = []

    # Find the data points that the perceptron has incorrectly classified
    # and record the number of errors it makes.
    iter_ = 0
    mistakes0, mistakes1 = eval_perceptron(neg_examples, pos_examples, w)
    num_errs = len(mistakes0) + len(mistakes1)
    num_err_history.append(num_errs)
    print "Number of erros in iteration {0}:\t{1}".format(iter_, num_errs)
    print "Weights:", w
    plot_perceptron(neg_examples, pos_examples, mistakes0, mistakes1, num_err_history,
                    w, w_dist_history)

    # If a generously feasible weight vector exists, record the distance
    # to it from the initial weight vector
    if len(w_gen_feas) != 0:
        w_dist_history.append(np.linalg.norm(w - w_gen_feas))

    while num_errs > 0:
        iter_ = iter_ + 1

        # Update weights of perceptron
        w = update_weights(neg_examples, pos_examples, w)

        # If a generously feasible weight vetor exists, record the distance
        # to it from the current weight vector
        if len(w_gen_feas) != 0:
            w_dist_history.append(np.linalg.norm(w - w_gen_feas))

        # Find the data points that the perceptron has incorrectly classified
        # and record the number of errors it makes.
        mistakes0, mistakes1 = eval_perceptron(neg_examples, pos_examples, w)
        num_errs = len(mistakes0) + len(mistakes1)
        num_err_history.append(num_errs)
        print "Number of erros in iteration {0}:\t{1}".format(iter_, num_errs)
        print "Weights:", w

        plot_perceptron(neg_examples, pos_examples, mistakes0, mistakes1, num_err_history,
                        w, w_dist_history)
        if pause:
            while True:
                try:
                    ans = input("Continue?")
                    if ans == 1 or ans == 'y':
                        break
                    if ans == 0 or ans == 'n':
                        return w
                except (ValueError, NameError):
                    print("Sorry, I didn't understand that.")
                    continue
    return w
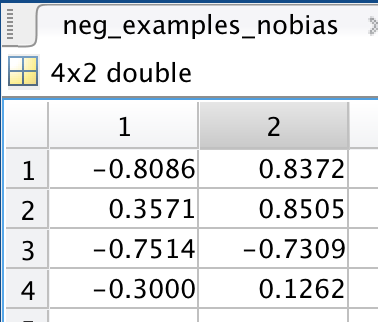
第一个参数是负例的2维特征向量:
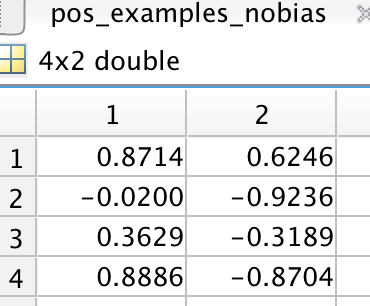
第二个参数则是正例:
第三个参数是权值向量的默认值:
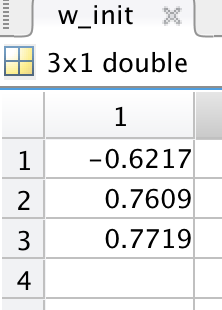
为什么多了一维呢?因为bias也放进去了。
第四个参数是某个固定的“严格可行”权值向量。
评估性能
每次迭代前先评估模型性能是否达到要求:
def eval_perceptron(neg_examples, pos_examples, w):
    """Evaluates the perceptron using a given weight vector. Here, evaluation
    refers to finding the data points that the perceptron incorrectly classifies.

    Args:
        neg_examples (numpy.array) : The num_neg_examples x 3 matrix for the examples with target 0.
            num_neg_examples is the number of examples for the negative class.
        pos_examples (numpy.array) : The num_pos_examples x 3 matrix for the examples with target 1.
            num_pos_examples is the number of examples for the positive class.
        w (numpy.array)            : A 3-dimensional weight vector, the last element is the bias.
    Returns:
        (tuple) :
            mistakes0 : A vector containing the indices of the negative examples that have been
                incorrectly classified as positive.
            mistakes1 : A vector containing the indices of the positive examples that have been
                incorrectly classified as negative.
    """
    mistakes0 = [i for i, sample in enumerate(neg_examples) if np.dot(sample, w)[0] >= 0]
    mistakes1 = [i for i, sample in enumerate(pos_examples) if np.dot(sample, w)[0] < 0]
    return mistakes0, mistakes1
分别计算的是假阳与假阴的个数。
权值更新
迭代中更新权值向量,要求完成这个函数:
def update_weights(neg_examples, pos_examples, w_current):
    """Updates the weights of the perceptron for incorrectly classified points
    using the perceptron update algorithm. This function makes one sweep over
    the dataset.

    Args:
        neg_examples (numpy.array) : The num_neg_examples x 3 matrix for the examples with target 0.
            num_neg_examples is the number of examples for the negative class.
        pos_examples (numpy.array) : The num_pos_examples x 3 matrix for the examples with target 1.
            num_pos_examples is the number of examples for the positive class.
        w_current (numpy.array)    : A 3-dimensional weight vector, the last element is the bias.
    Returns:
        (numpy.array) : The weight vector after one pass through the dataset using the perceptron
            learning rule.
    """
    w = w_current
    for sample in neg_examples:
        assert len(np.shape(sample)) == 1 and np.shape(w)[1] == 1
        activation = np.dot(sample, w)[0]
        if activation >= 0:
            w += np.column_stack(sample).T * (0.0 - activation)
    for sample in pos_examples:
        assert len(np.shape(sample)) == 1 and np.shape(w)[1] == 1
        activation = np.dot(sample, w)[0]
        if activation < 0:
            w += np.column_stack(sample).T * (1.0 - activation)
    return w
只有在出错(即activation与y符号相反)才更新权值;更新时用无学习率版的delta rule ![]() 。有些实现会直接用x去更新,另一些会乘以学习率,大同小异。
。有些实现会直接用x去更新,另一些会乘以学习率,大同小异。
可视化
然后就是可视化了,这个函数也是写好了的:
def plot_perceptron(neg_examples, pos_examples, mistakes0, mistakes1,
                    num_err_history, w, w_dist_history):
    """The top-left plot shows the dataset and the classification boundary given by
    the weights of the perceptron. The negative examples are shown as circles
    while the positive examples are shown as squares. If an example is colored
    green then it means that the example has been correctly classified by the
    provided weights. If it is colored red then it has been incorrectly classified.
    The top-right plot shows the number of mistakes the perceptron algorithm has
    made in each iteration so far.

    The bottom-left plot shows the distance to some generously feasible weight
    vector if one has been provided (note, there can be an infinite number of these).
    Points that the classifier has made a mistake on are shown in red,
    while points that are correctly classified are shown in green.

    The goal is for all of the points to be green (if it is possible to do so).

    Args:
        neg_examples    : The num_neg_examples x 3 matrix for the examples with target 0.
                          num_neg_examples is the number of examples for the negative class.
        pos_examples    : The num_pos_examples x 3 matrix for the examples with target 1.
                          num_pos_examples is the number of examples for the positive class.
        mistakes0       : A vector containing the indices of the datapoints from class 0 incorrectly
                          classified by the perceptron. This is a subset of neg_examples.
        mistakes1       : A vector containing the indices of the datapoints from class 1 incorrectly
                          classified by the perceptron. This is a subset of pos_examples.
        num_err_history : A vector containing the number of mistakes for each
                          iteration of learning so far.
        w               : A 3-dimensional vector corresponding to the current weights of the
                          perceptron. The last element is the bias.
        w_dist_history  : A vector containing the L2-distance to a generously
                          feasible weight vector for each iteration of learning so far.
                          Empty if one has not been provided.
    """
    f = plt.figure(1)

    neg_correct_ind = np.setdiff1d(range(len(neg_examples)), mistakes0)
    pos_correct_ind = np.setdiff1d(range(len(pos_examples)), mistakes1)
    assert all(m_idx not in set(neg_correct_ind) for m_idx in mistakes0) and \
           all(m_idx not in set(pos_correct_ind) for m_idx in mistakes1)

    plt.subplot(2, 2, 1)
    plt.hold(True)
    if np.size(neg_examples):
        plt.plot(neg_examples[neg_correct_ind][:, 0], neg_examples[neg_correct_ind][:, 1], 'og', markersize=10)
    if np.size(pos_examples):
        plt.plot(pos_examples[pos_correct_ind][:, 0], pos_examples[pos_correct_ind][:, 1], 'sg', markersize=10)

    if len(mistakes0):
        plt.plot(neg_examples[mistakes0][:, 0], neg_examples[mistakes0][:, 1], 'or', markersize=10)
    if len(mistakes1):
        plt.plot(pos_examples[mistakes1][:, 0], pos_examples[mistakes1][:, 1], 'sr', markersize=10)

    plt.title('Perceptron Classifier')
    # In order to plot the decision line, we just need to get two points.
    plt.plot([-5, 5], [(-w[-1] + 5 * w[0]) / w[1], (-w[-1] - 5 * w[0]) / w[1]], 'k')
    plt.xlim([-1, 4])
    plt.ylim([-2, 2])
    plt.hold(False)

    plt.subplot(2, 2, 2)
    plt.plot(range(len(num_err_history)), num_err_history)
    plt.xlim([-1, max(15, len(num_err_history))])
    plt.ylim([0, len(neg_examples) + len(pos_examples) + 1])
    plt.title('Number of errors')
    plt.xlabel('Iteration')
    plt.ylabel('Number of errors')

    plt.subplot(2, 2, 3)
    plt.plot(range(len(w_dist_history)), w_dist_history)
    plt.xlim([-1, max(15, len(num_err_history))])
    plt.ylim([0, 15])
    plt.title('Distance')
    plt.xlabel('Iteration')
    plt.ylabel('Distance')
    plt.show()
调用方法
import matplotlib.pylab as pylab

pylab.rcParams['figure.figsize'] = 12, 8

import scipy.io
import os
import matplotlib.pyplot as plt

data_path = os.path.join(os.getcwd(), 'data/')
files = ['dataset%d' % i for i in range(1, 5)]

dataset_file = os.path.join(data_path, files[2])
data = scipy.io.loadmat(dataset_file)

w = learn_perceptron(data['neg_examples_nobias'],
                     data['pos_examples_nobias'],
                     data['w_init'],
                     data['w_gen_feas'])
结果
Python是这个效果:

红色表示分错类别的。
由于matlab输出gif特方便,所以把四个数据集用matlab版本跑了一遍:

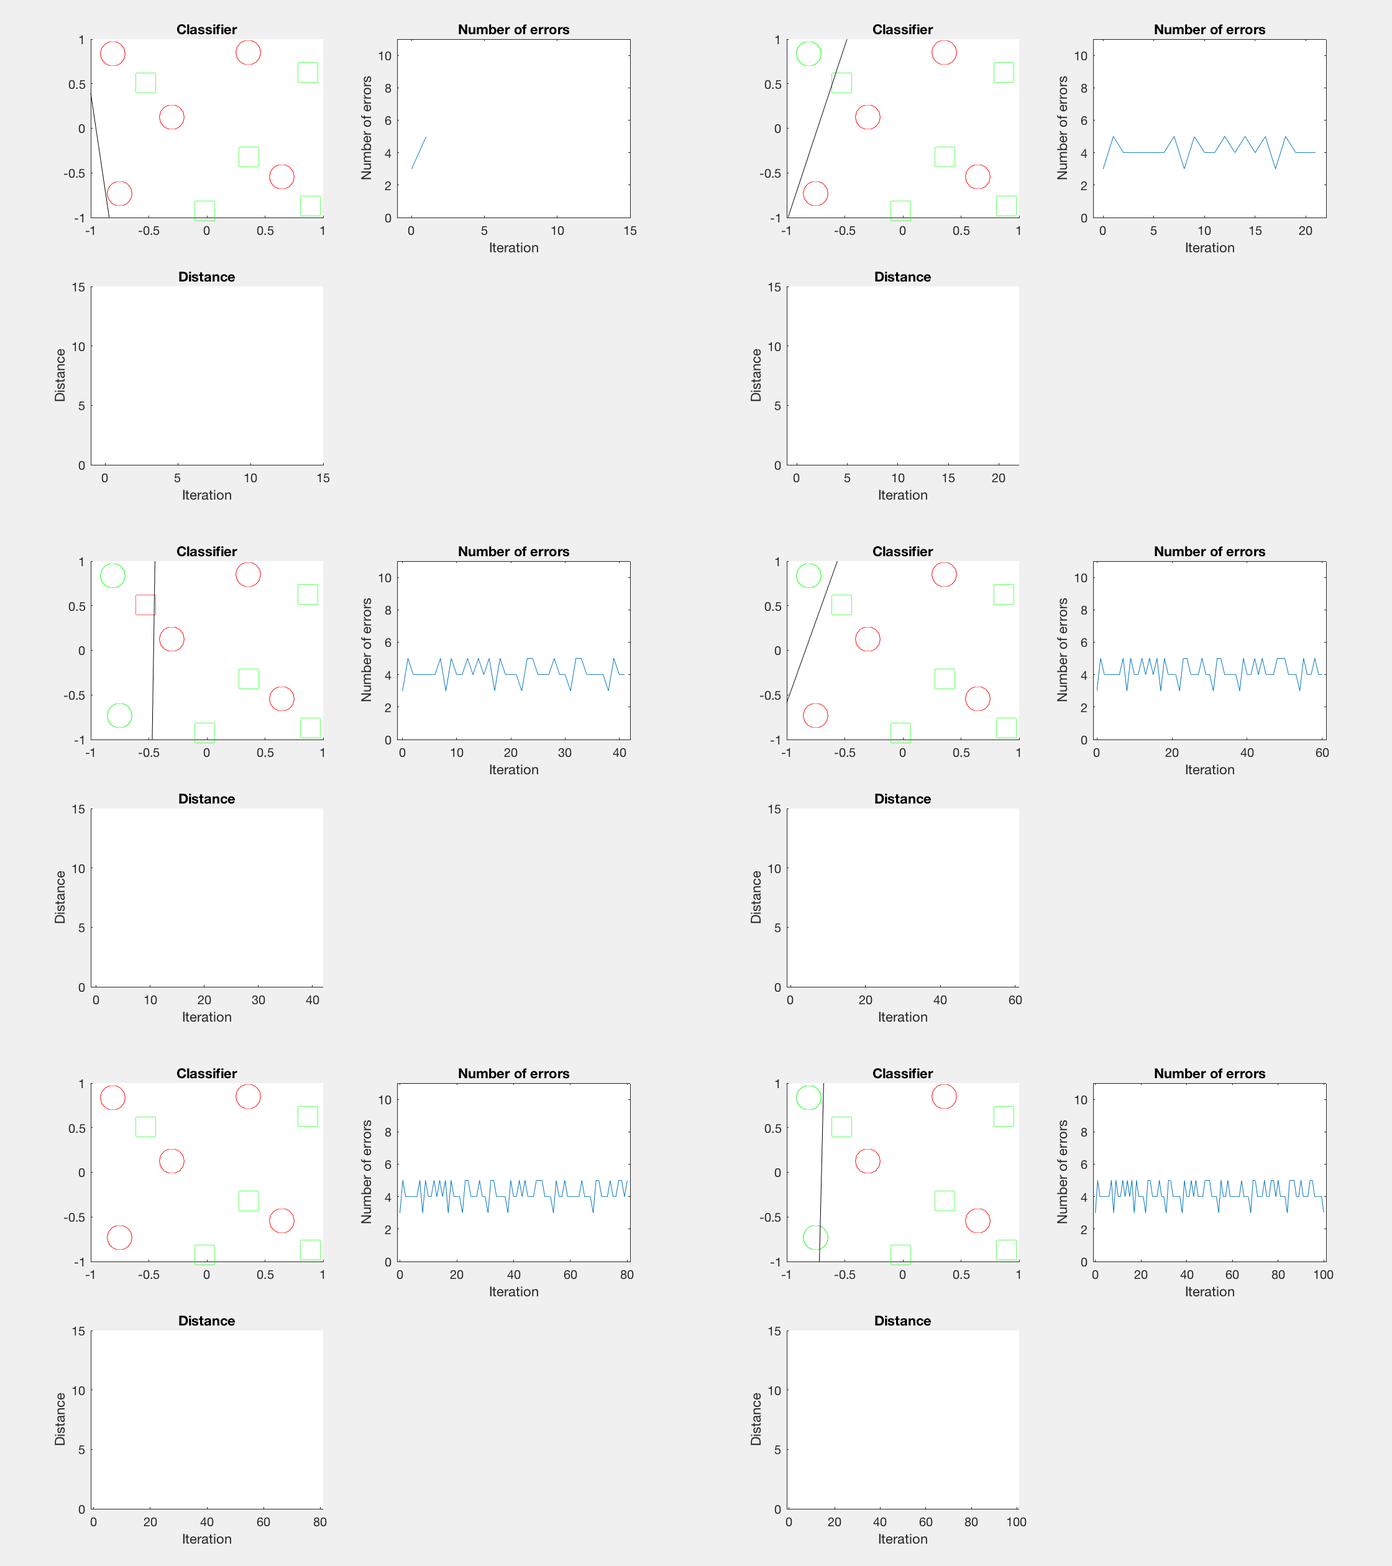
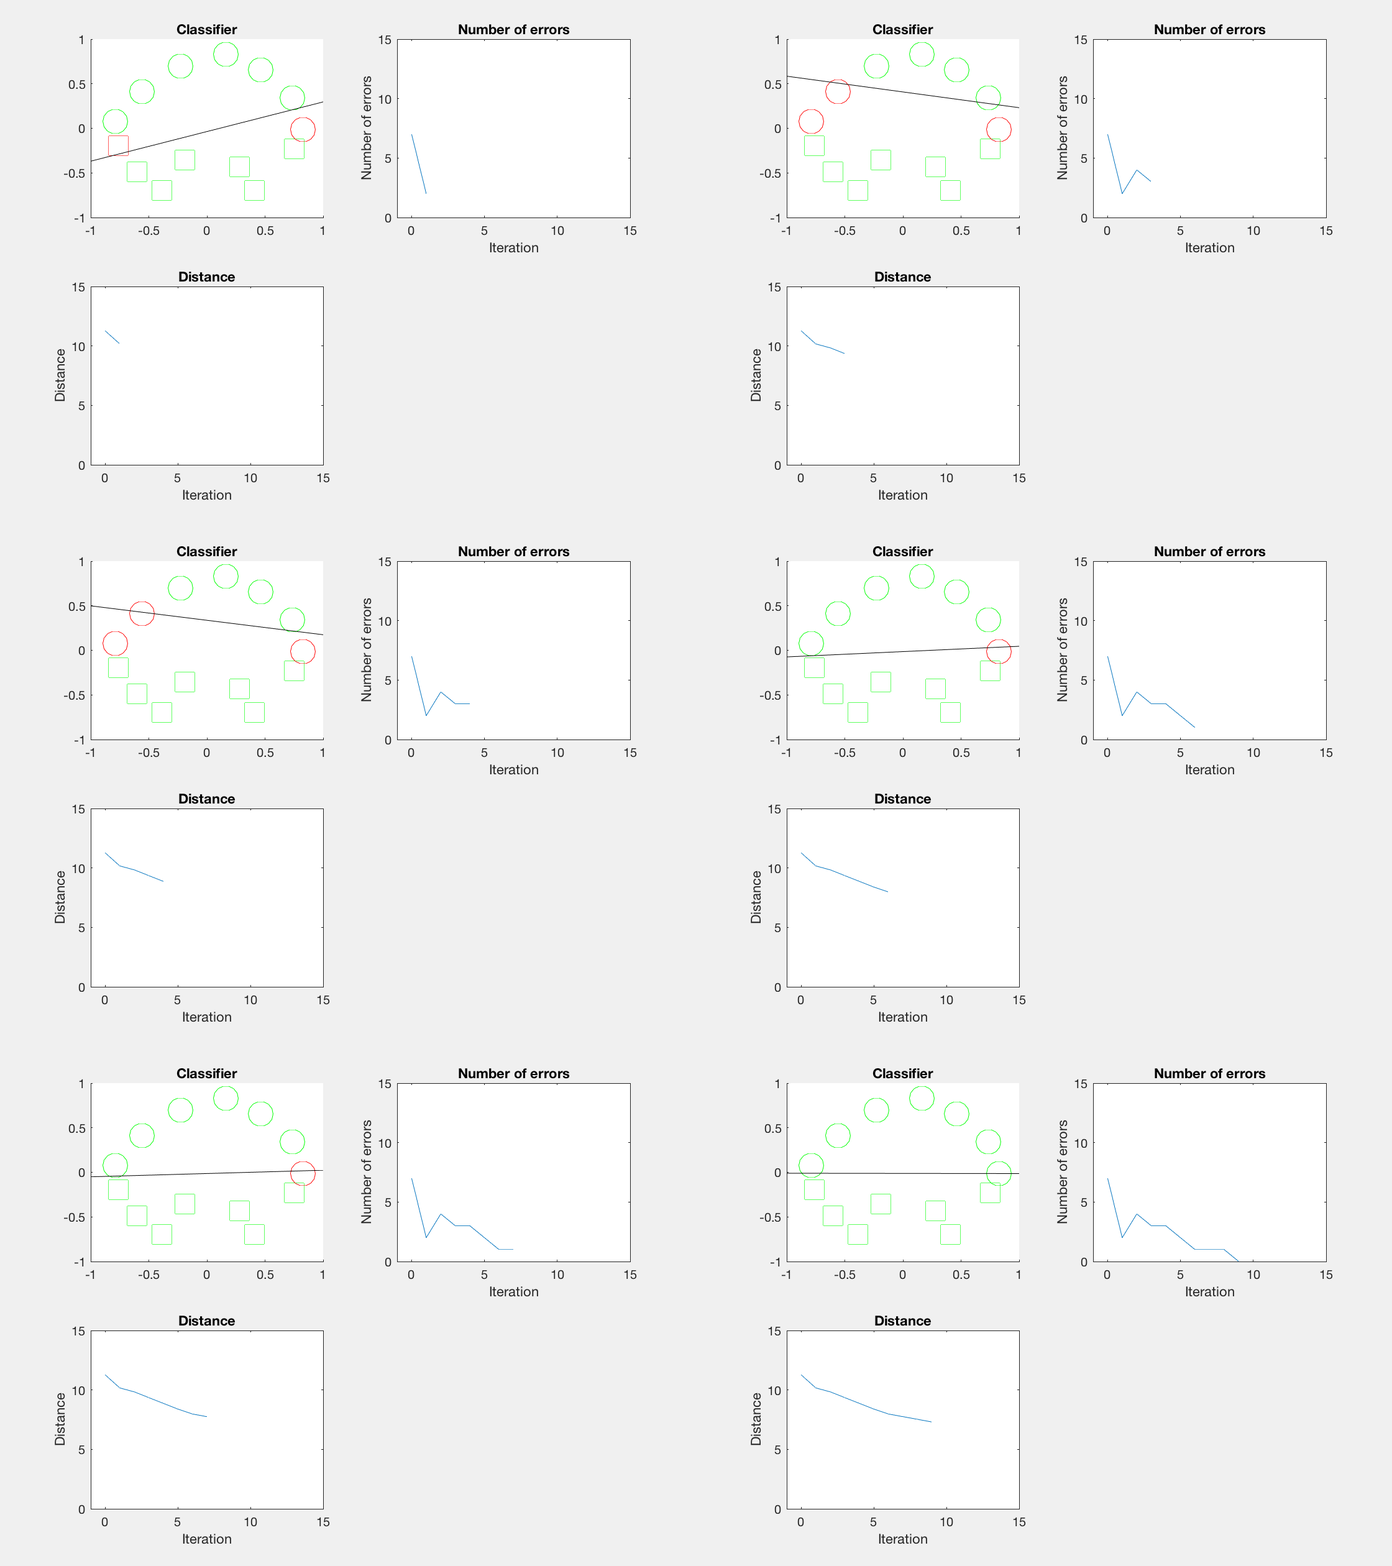
验证了如果存在generously feasible weight vector的话distance会逐步减小。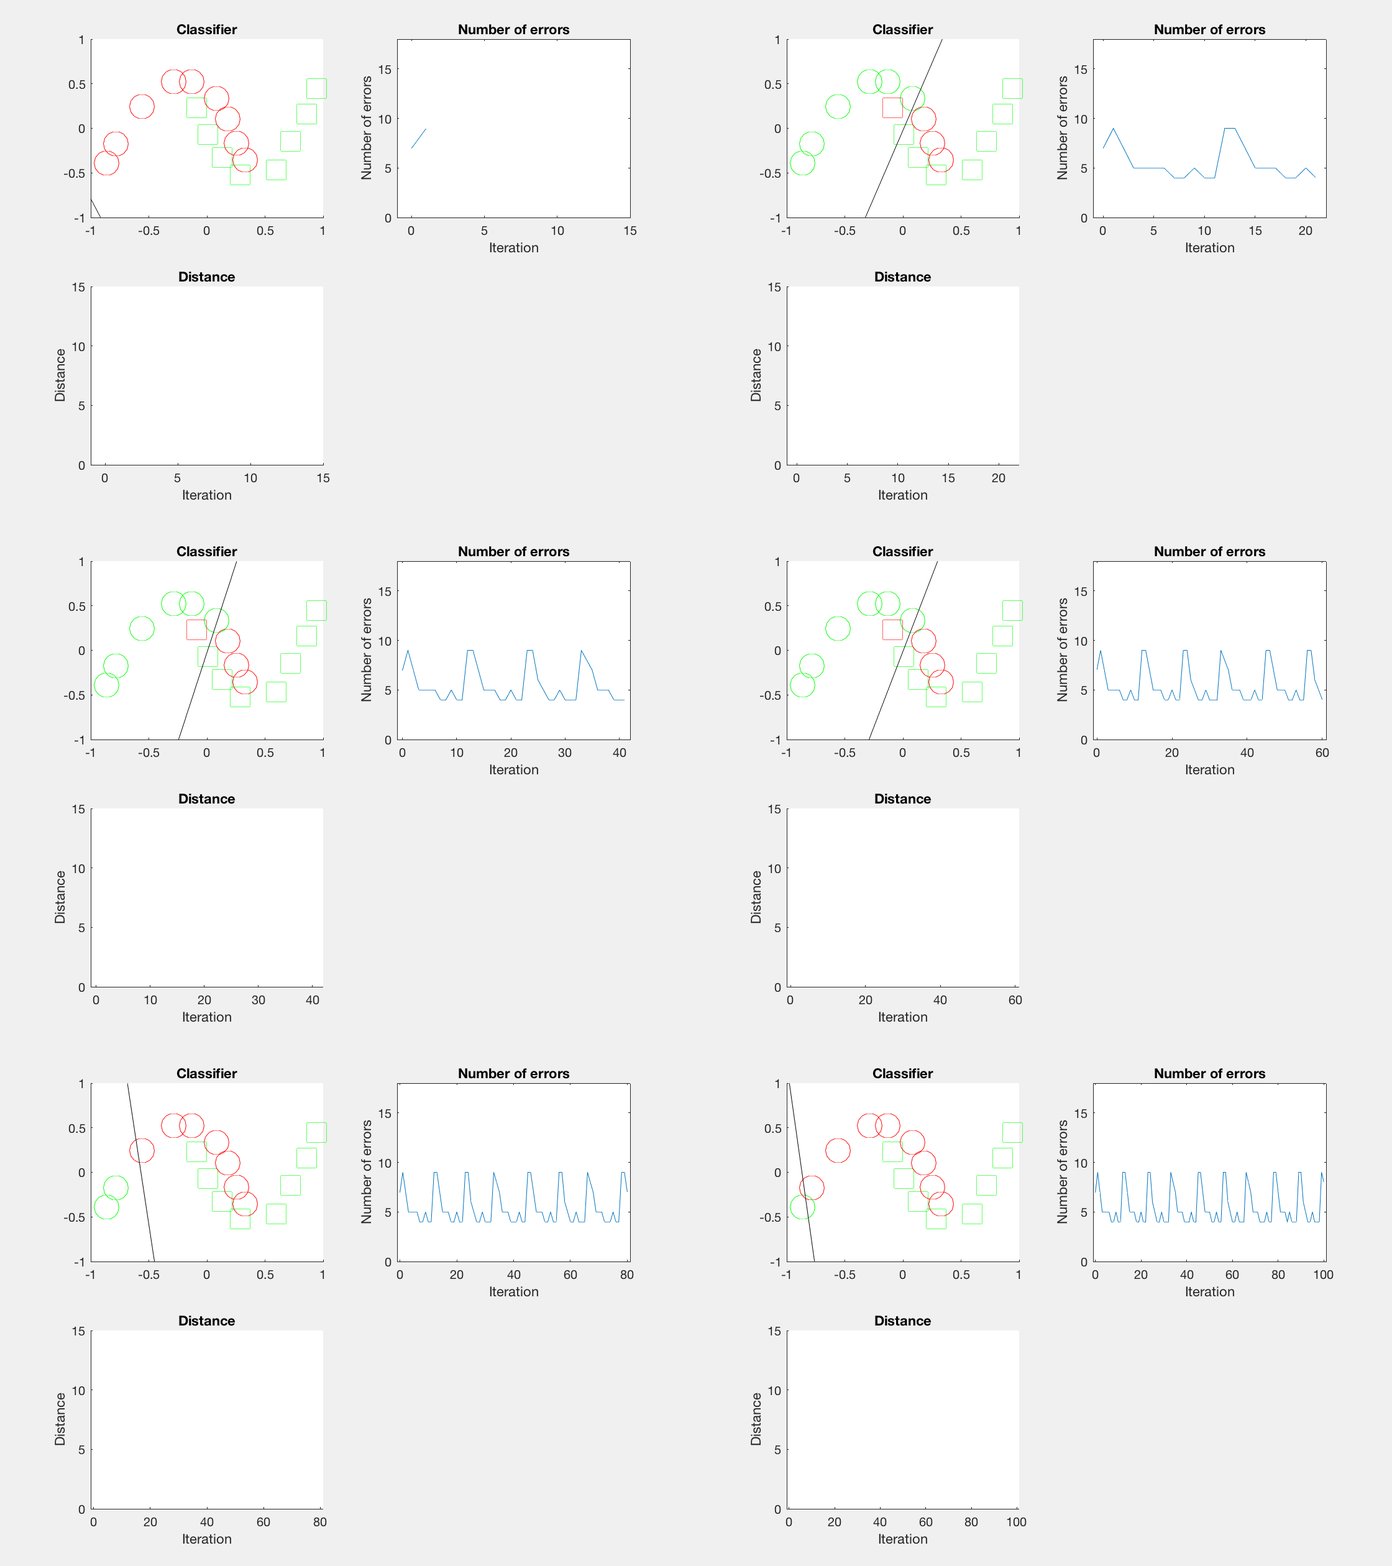
最后这个是个正弦波,导致错误率也反复震荡。
Reference
https://github.com/hankcs/coursera-neural-net
![]() 知识共享署名-非商业性使用-相同方式共享:码农场 » Hinton神经网络公开课编程练习1 The perceptron learning algorithm
知识共享署名-非商业性使用-相同方式共享:码农场 » Hinton神经网络公开课编程练习1 The perceptron learning algorithm
 码农场
码农场
楼主威武,我正愁呢,想用python,又不是特别熟悉
请问楼主最后那个动图在MATLAB中怎么实现的呢?